Vol.78, No.9 September 2016
Explanation of the cover photographs
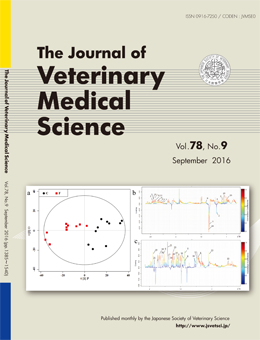
Nuclear magnetic resonance-based serum metabolic profiling of dairy cows with footrot
Jiasan Zheng et al. (pp.1421–1428)
OPLS-DA comparison of serum spectra between controls and footrot.
The score plot (Fig. 3a) showed significant metabolic perturbation in the footrot group. Corresponding color-coded loadings plots (Fig. 3b and 3c) were generated by correlation coefficient from blue to red. Red colored metabolites in the figure legend contribute more significantly to class discrimination than blue colored metabolites. The upward and downward peaks represent decreased and increased levels in cows with footrot, respectively.
This number is available on J-STAGE
https://www.jstage.jst.go.jp/browse/jvms/78/9/_contents